With Woodstock Foundation
Opening Illinois Housing Data
Evaluating neighborhood health with mortgage, income, and employment data
The housing crisis deeply impacted millions of Americans. Communities, both urban and rural, are still far from recovery. Neighborhoods experienced the housing crisis in different ways. There isn’t a one-size-fits-all solution to the problems that communities still face.
We worked with the Woodstock Foundation, a economic justice organization in Illinois, to create a data and mapping tool on housing and economic conditions to the neighborhood level.
The site brings together 74 datasets on the well-being of local communities. Data ranges from the average amount of mortgage debt people take on to the rate of foreclosure filings in the Chicago region and elsewhere in Illinois. The tool provides a roadmap to the dozens of local organizations that are working in housing and economic justice in Illinois. Community organizations in Illinois use the tool to inform their decisions on where to how to do their work.
 Where the highest income census tracts are in the Chicago six-county region
Optimizing for big, complex data
Housing data is complex, and Woodstock Foundation gathered amazingly granular statistics about housing data in Illinois. This data existed primarily in spreadsheets. Woodstock is a small nonprofit, and we wanted to ease as much as possible the burden of maintaining a complicated website.
We wrote a python library to break up their spreadsheets into JSON. Every time you switch to a new facet of housing data, every time you view a different year or category of that data, your browser incrementally downloads a new JSON file. Although those files in aggregate would take ages to load, individually they are manageable. Those scripts, along with the rest of the site, are open-source.
To further reduce load times, we use the topojson spec to reduce the size of geographic boundary data. This allowed us to separate geographic data from numerical data, and only download those complex census tract boundaries once. As you select new indicators, code that runs in your browser re-connects the new data to those boundaries on the fly.
Using vector-based geographical boundaries has other benefits. It allowed us to use a mouse click on an overlaying geographic boundary and a point-in-polygon test to find, for example, which congressional representative is responsible for which census tract.
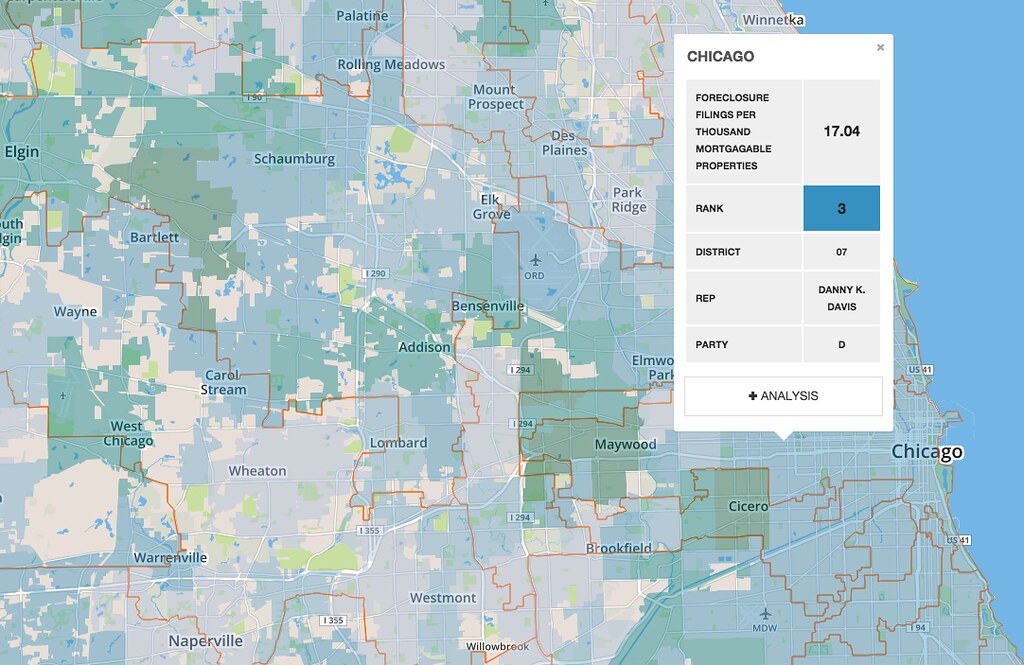 Detecting congressional boundaries
Census tracts over multiple years
Census tracts change between census years, creating problems when mapping census tract data over multiple years. Tract ID, or FIPS codes can either refer to a different neighborhood or disappear entirely.
As part of this project we built an open source tool, the pulls from Census Bureau relationship files to show the difference between two years.