With World Bank
Mapping the Electricity Grid from Space
Using machine learning to augment human tracing of electricity infrastructure
.jpg)
We built a pipeline to efficiently map the high-voltage (HV) grid at a country-wide scale on OpenStreetMap.
Many people in the world still do not have access to electricity. In developing nations, this problem is especially acute as it limits participation in modern economy and culture. Improving the electric grid is challenging in these regions because they sometimes lack a complete and accurate map of the existing HV infrastructure. Using both human knowledge and machine learning, we worked with the World Bank to build a repeatable solution to create these maps.
Identifying the grid
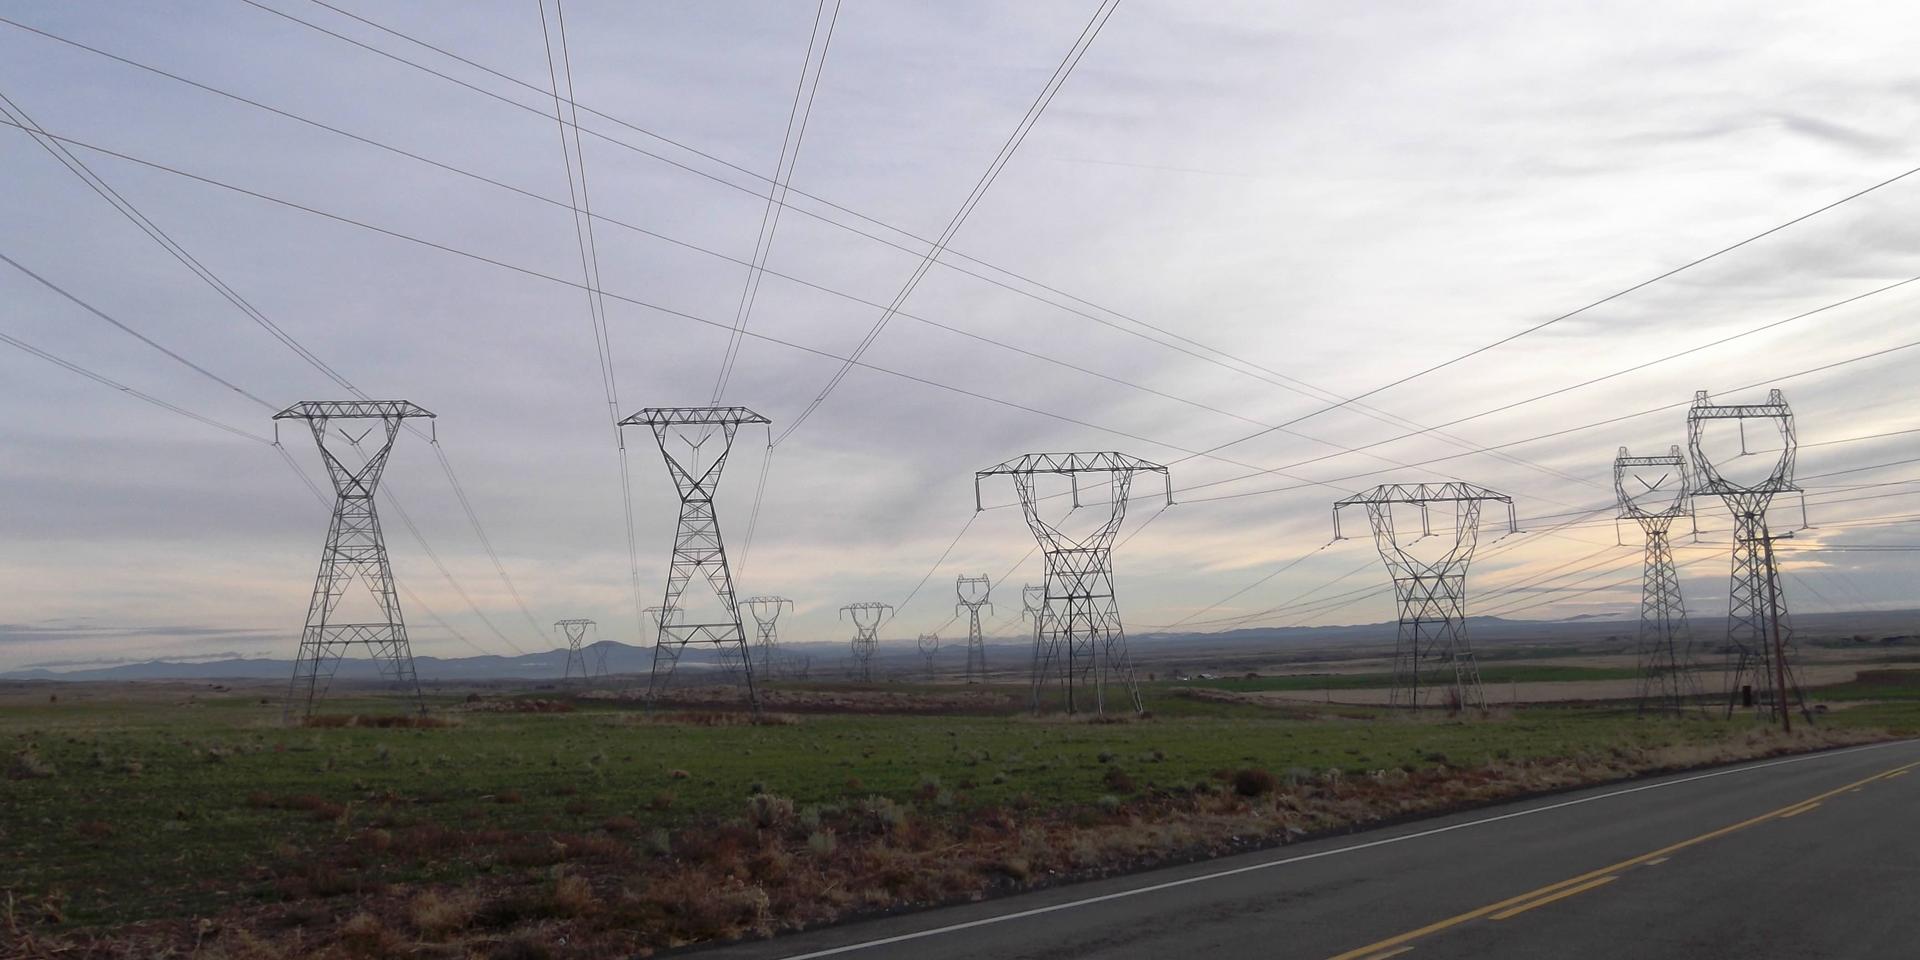
The most recognizable components of a HV grid are its towers — metal structures tens of meters tall that are visible from satellite imagery. These towers (and the high-voltage lines connecting them) form the network’s backbone and transmit electricity across long distances.
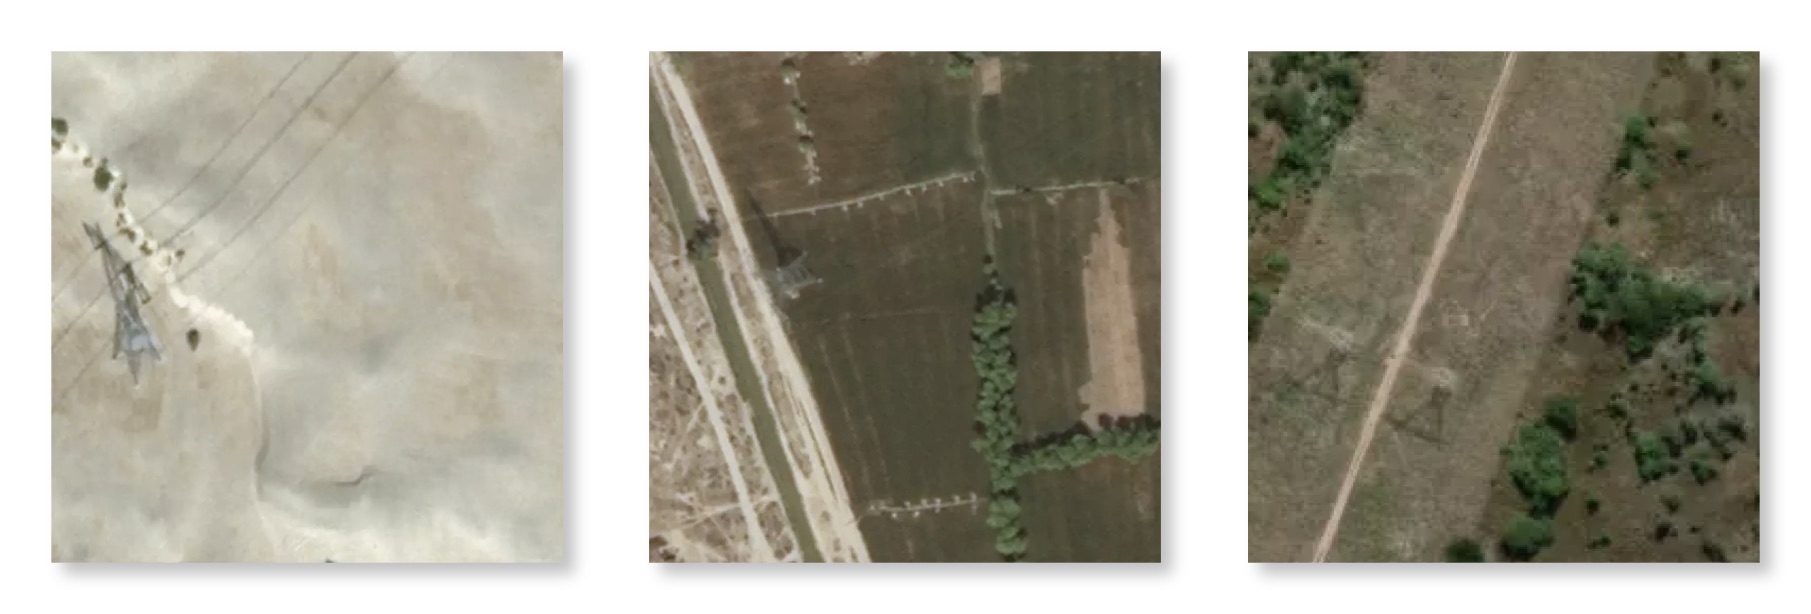
Skilled mappers working with satellite imagery can identify these prominent towers in multiple contexts (e.g., desert, forest, urban areas, etc.), but their efforts don’t scale well at this task — it’s slow and tedious to review large regions. In small-scale tests with our Data Team, we found that our professional mappers could cover about 120 km^2 per hour; to manually map a country the size of Pakistan, that would require over 7000 hours of work (or one person working 40 hour weeks for 3.5 years straight).
To reduce the manual effort needed, we built an ML model to detect HV towers within satellite images. We were able to train a single ML model — specifically, the Xception convolutional neural network (Chollet, 2016) — to recognize HV towers in satellite imagery covering Nigeria, Pakistan, and Zambia. Machine learning pipelines can process hundreds of thousands of images per hour, so we were able to quickly generate country-wide maps of the grid. Our model achieved a high true positive rate while testing, but it was not perfect: wind turbines, sand dunes with long thin shadows, and gridded farmland all confused it.
Connecting humans and machines
To map the HV network, we combined the strengths of humans (high accuracy) with machines (rapid throughput) in a symbiotic way. We used the ML model to generate a country-wide prediction map indicating areas likely to contain HV towers. With this map, our Data Team focused their efforts on these high-value areas instead of manually reviewing the entire country.
The predictions were imported as a tile layer within an OSM editor (specifically, JOSM). Using this strategy of combing humans and machines, we were able to improve the mapping speed by about 33x.