With Humanitarian OpenStreetMap Team
Measuring Map Completeness for Malaria Prevention
A machine learning model to analyze OpenStreetMap completeness
.jpg)
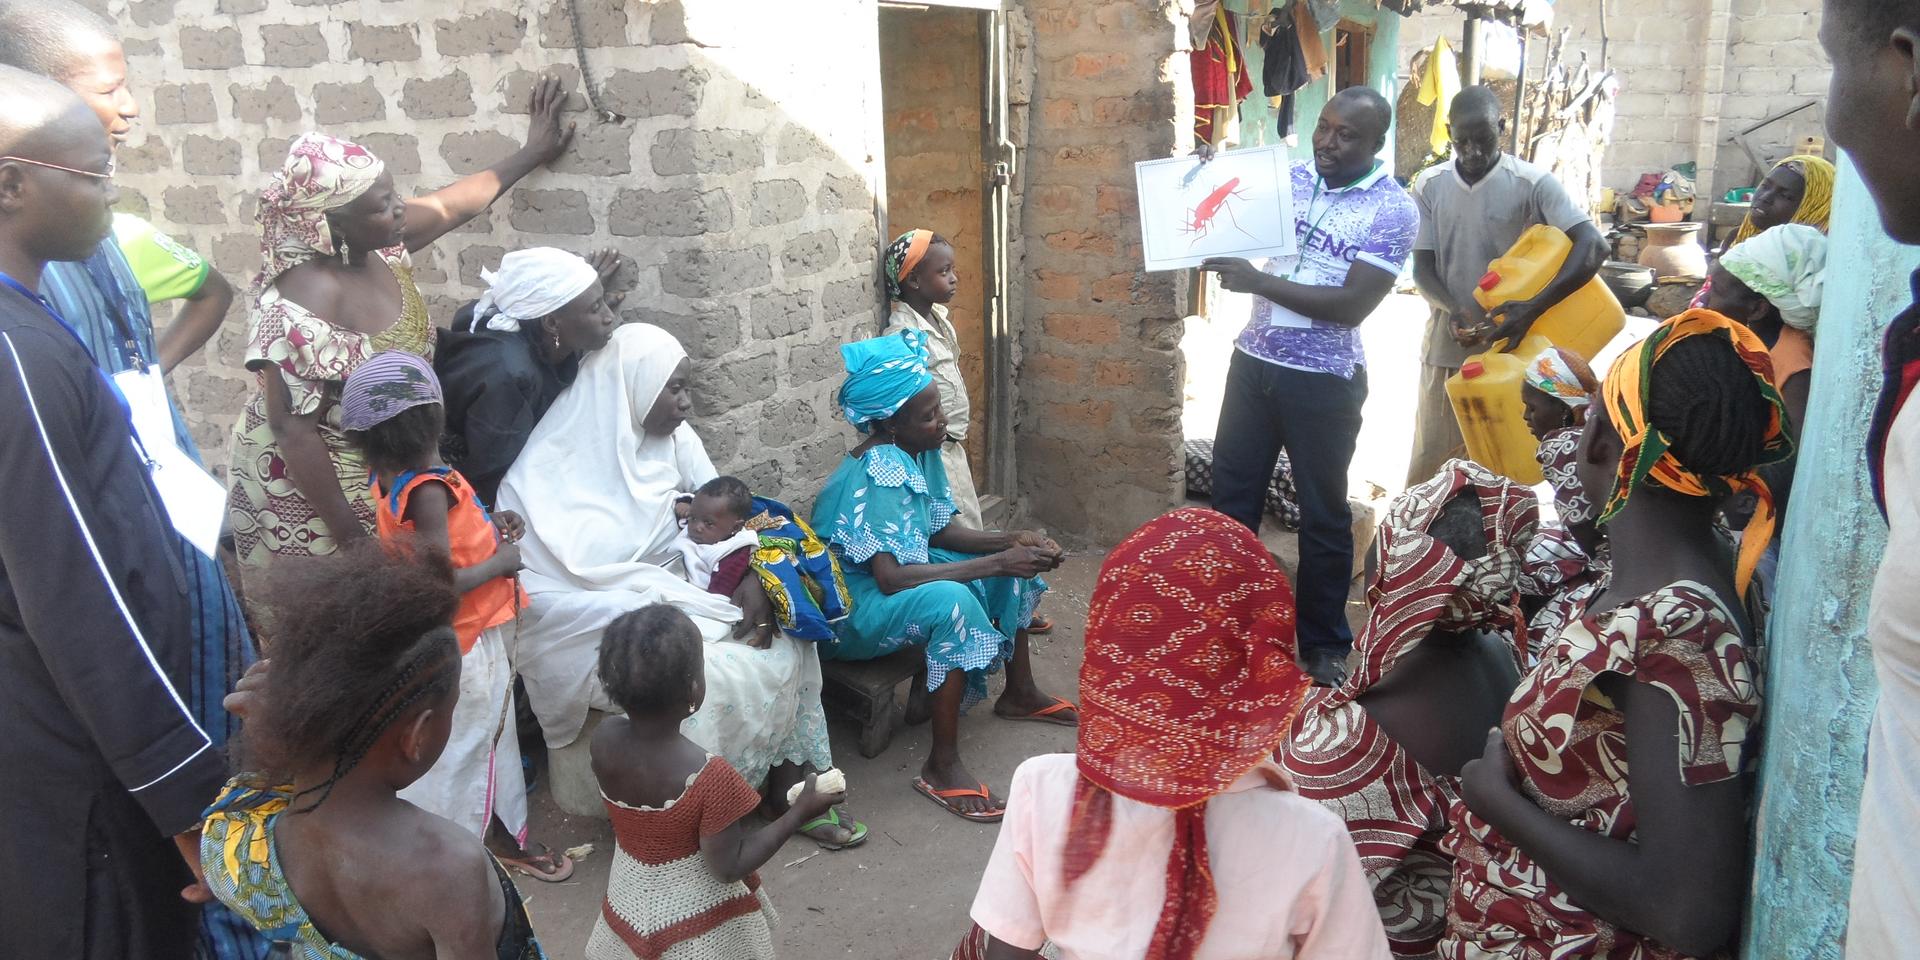
Malaria kills hundreds of thousands a year, and spraying efforts to stop malaria-spreading mosquitos rely on accurate locations of inhabited buildings. HOT Analytics for Health uses machine learning and satellite imagery to identify where maps - in this case, OpenStreetMap - are incomplete. By comparing mapped area against population density figures, the platform shows where vulnerable populations are likely underrepresented by public data.
HOT has been working with partners like the Clinton Health Access Initiative (CHAI) and the Botswana Ministry of Health and Wellness on malaria elimination. Their work involves carefully planning spraying campaigns, distributing prevention supplies, and prioritizing future ground efforts. Their campaigns, often in dense urban areas, are only as effective as their data. Even a small gap could undermine the effort to tackle the growth and spread of mosquitoes.
Satellite Imagery, WorldPop and Machine Learning
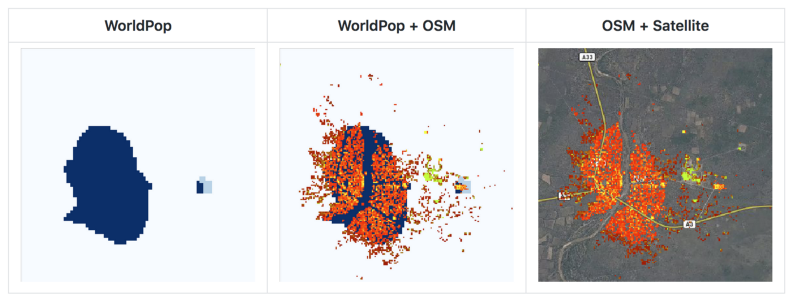
The HOT Analytics for Health model uses a supervised machine learning appoach to detect buildings, and correlates those predictions with population density figures from WorldPop, a public population dataset that incorporates imagery analysis along with census, surveys, and other sources.
By comparing known population and detected building footprints against built-up area mapped in OpenStreetMap, the model can detect gaps in building density, suggesting where OpenStreetMap is incomplete.
The model uses training data from urban and rural areas in Botswana, where OpenStreetMap has good coverage. Compared against WorldPop, which is available at 100 square meter grids, the model can detect missing buildings at high resolution. Using a higher-resolution population data layer could further improve this.
Measuring progress
OpenStreetMap coverage is constantly improving, and HOT Analytics for Health measures this progress over time, generating reports for areas of interest where operators have focused their efforts. The reports highlight both geometry and attribute/metadata completeness, examine last-edit timestamps for recency, and can even signal errors such as duplicate buildings.
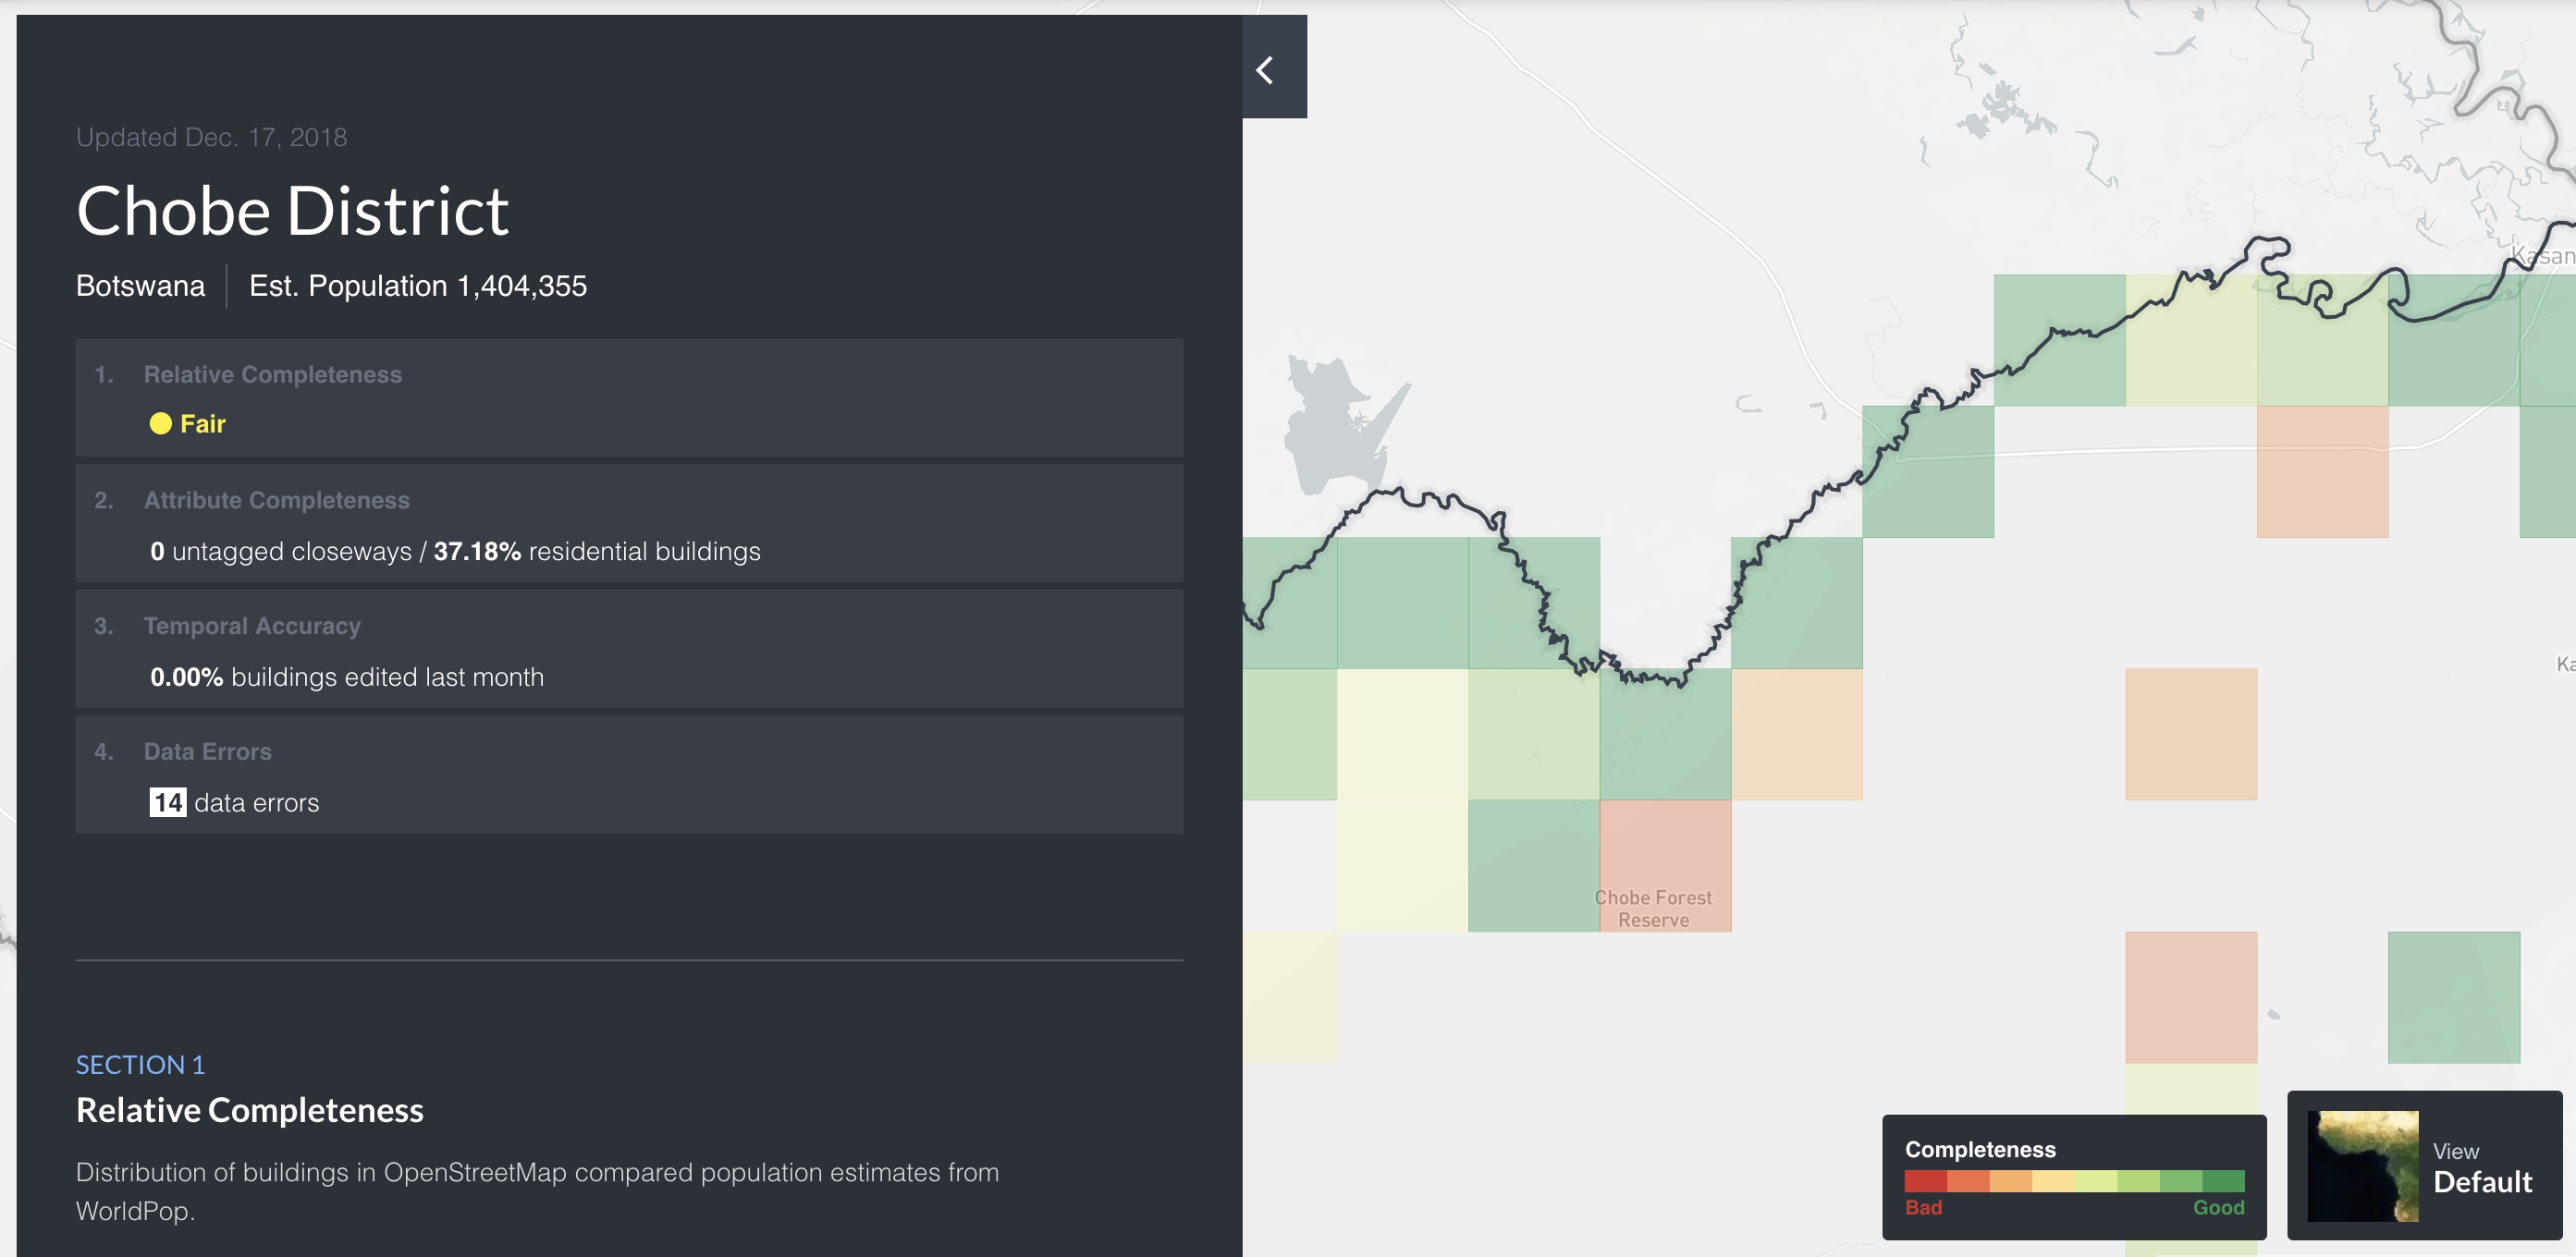
Mapping project managers use these reports to continuously evaluate the progress of mapping. The reports help prioritize new mapping efforts, and are a first line of defense against validation issues.
By tracking the improvement of OpenStreetMap, HOT Analytics for Health reports become the most comprehensive view of data readiness, and become an effective tool for planning campaigns and distributing supplies.
Scalable Infrastructure
While the initial phase of the project focuses on a few countries, the infrastructure can scale globally.
The platform runs on an AWS Batch pipeline that reads in WorldPop data and OSM QA tiles. This pipeline generates data on a weekly basis, which is then fed to other scheduled tasks that ingest this data to do things like create reports for areas of interest.
The entire infrastructure runs on the cloud using spot instances, which run and are billed only for their allotted task. With good, regional-specific training data, HOT Analytics for Health could scale to run at a global level.
We continue to look for ways to support international health and development using OpenStreetMap data and software, and are proud to partner with HOT and Azavea on this platform. Much of the code running HOT Analytics for Health is open source at the link below.