With World Bank
Nighttime Lights
Monitor rural electrification in 600,000 villages over twenty years. From space.
Nightlights displays and compares nighttime light data across 600,000 villages in India for every night over last 20 years. Working with the World Bank and the University of Michigan, we turned six billion data points extracted from terabytes of nighttime satellite imagery into useful, accessible data. From this complex data, we can see everything from political maneuvering to Diwali celebrations. The tool we built to visualize this data helps citizens, government officials, and development investors gain real insights into the impact of state-funded electrification projects.
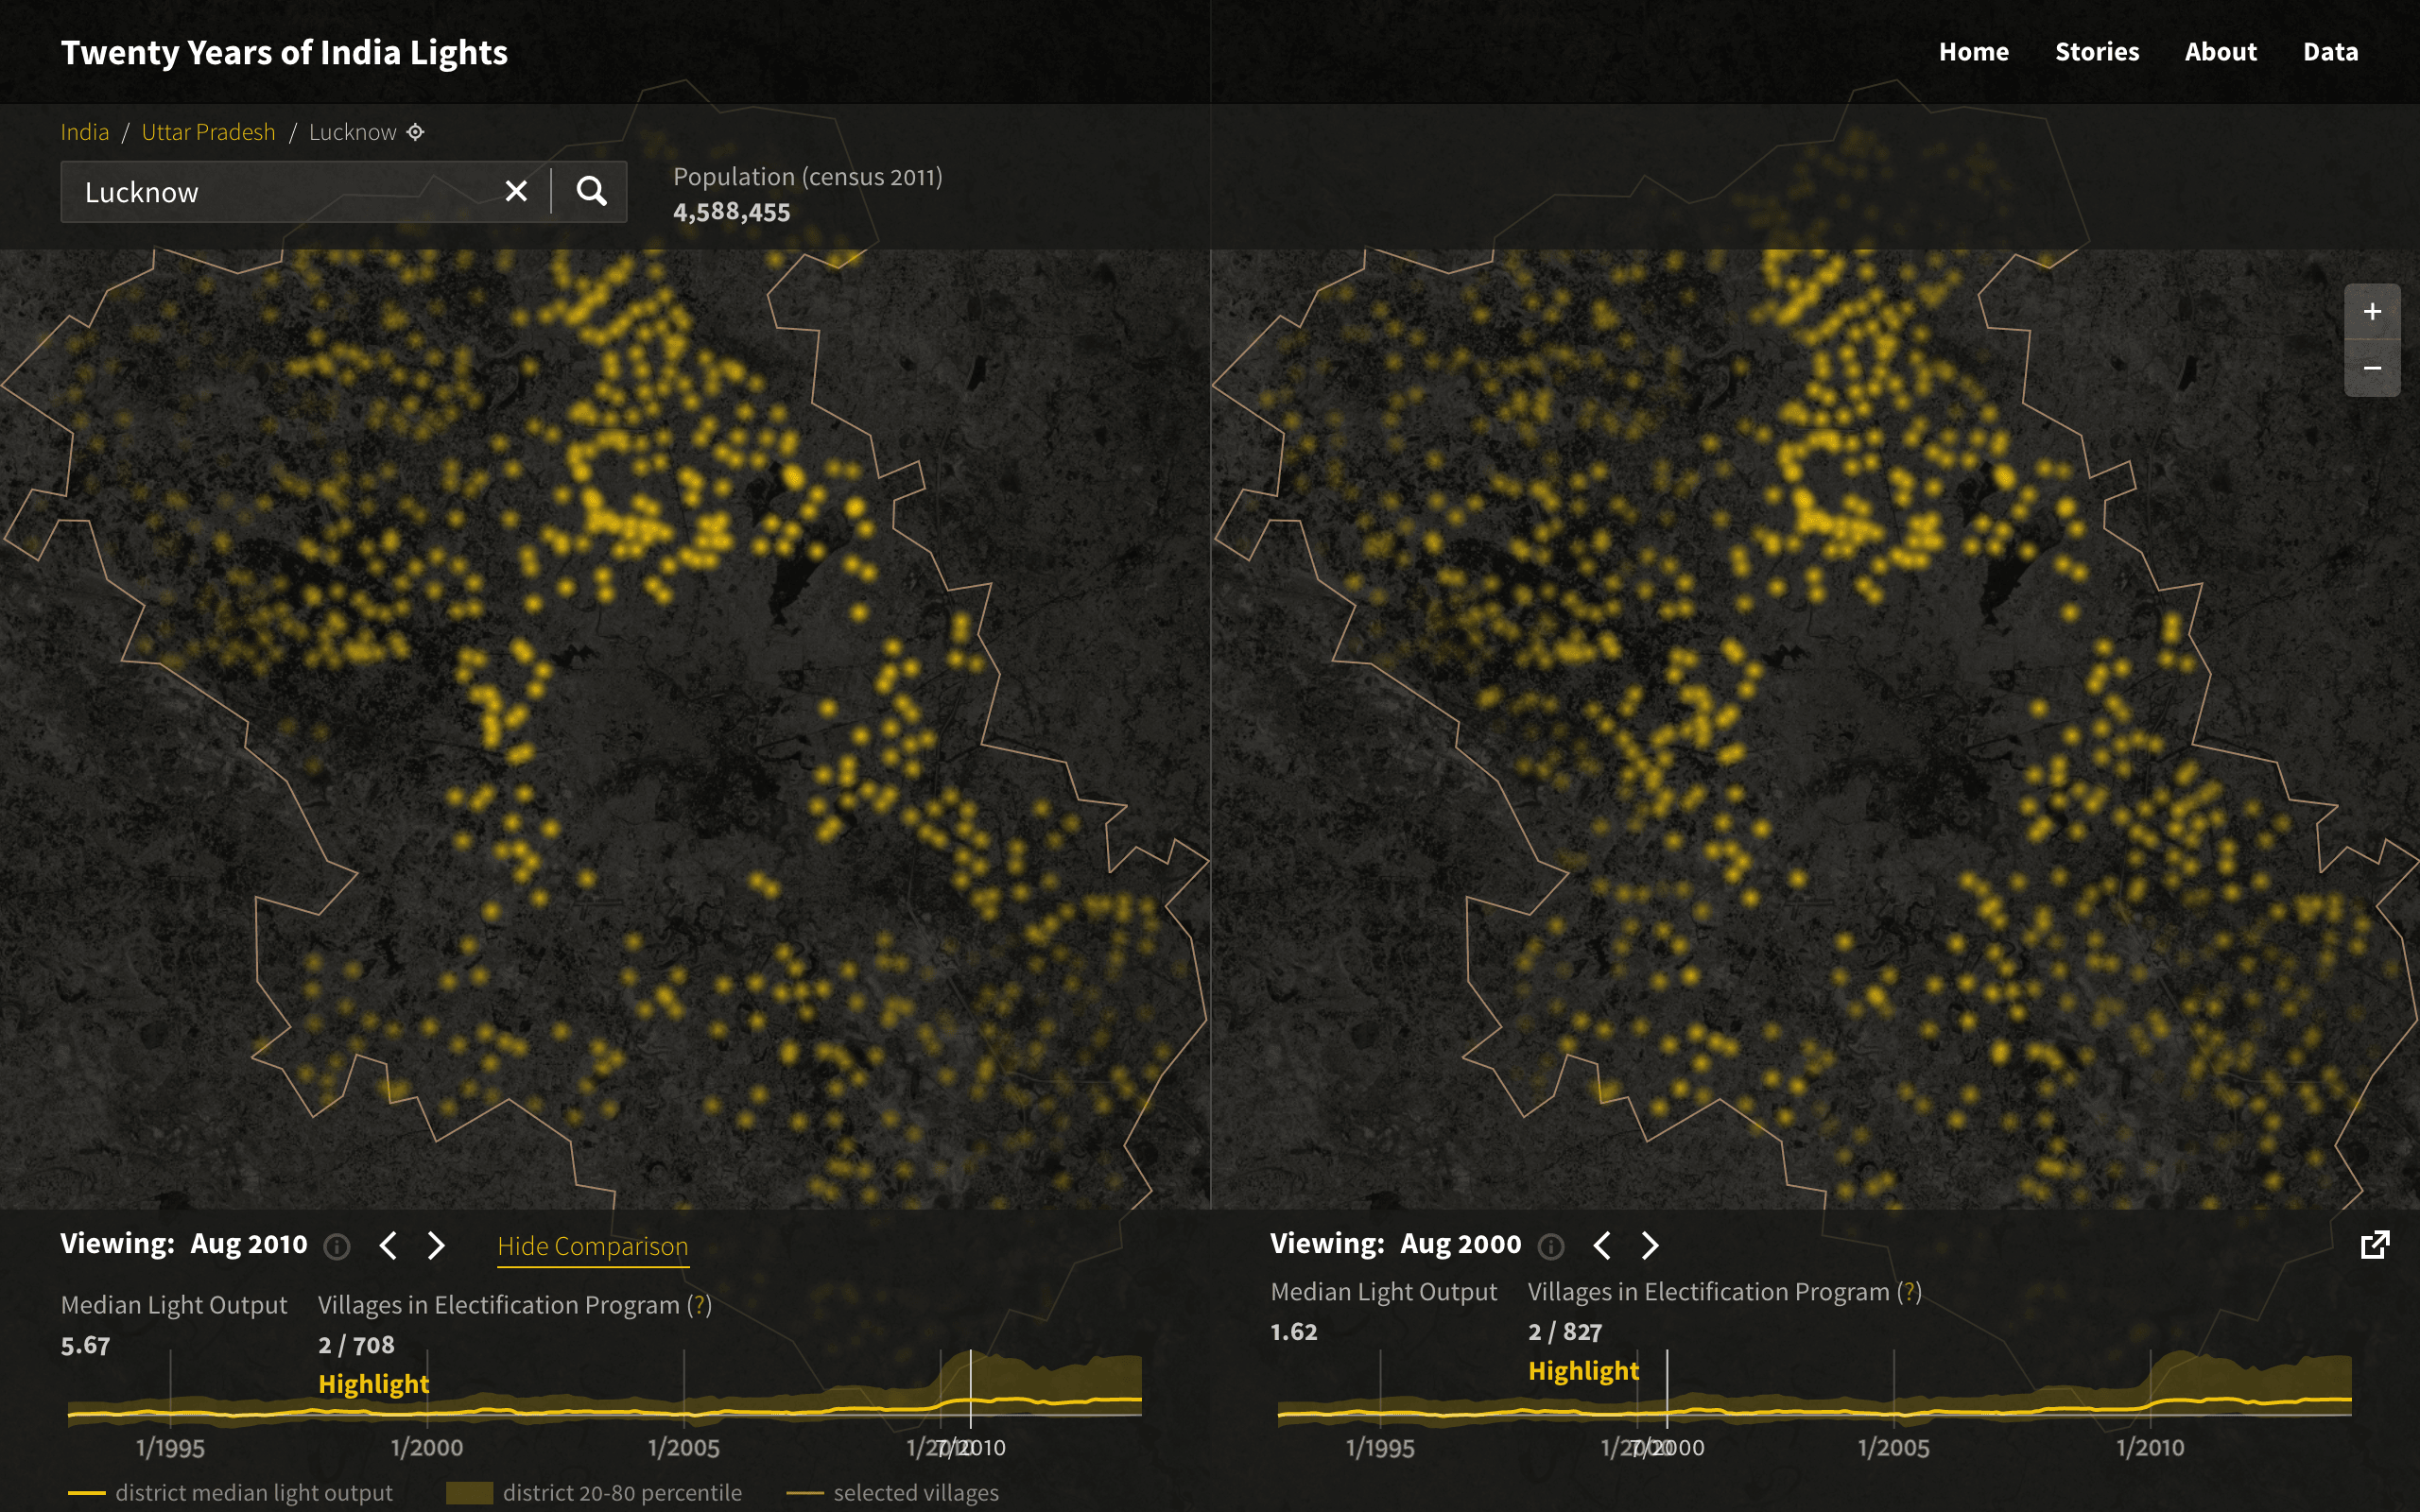
Billions of dollars go into development projects that connect rural areas to the electricity grid. But years after they’re done, logistical and reporting barriers prevent clear assessment of how much electricity each village actually gets and how reliable it is. In the face of these challenges, satellite data offers a powerful combination of consistency, completeness, and objectivity.
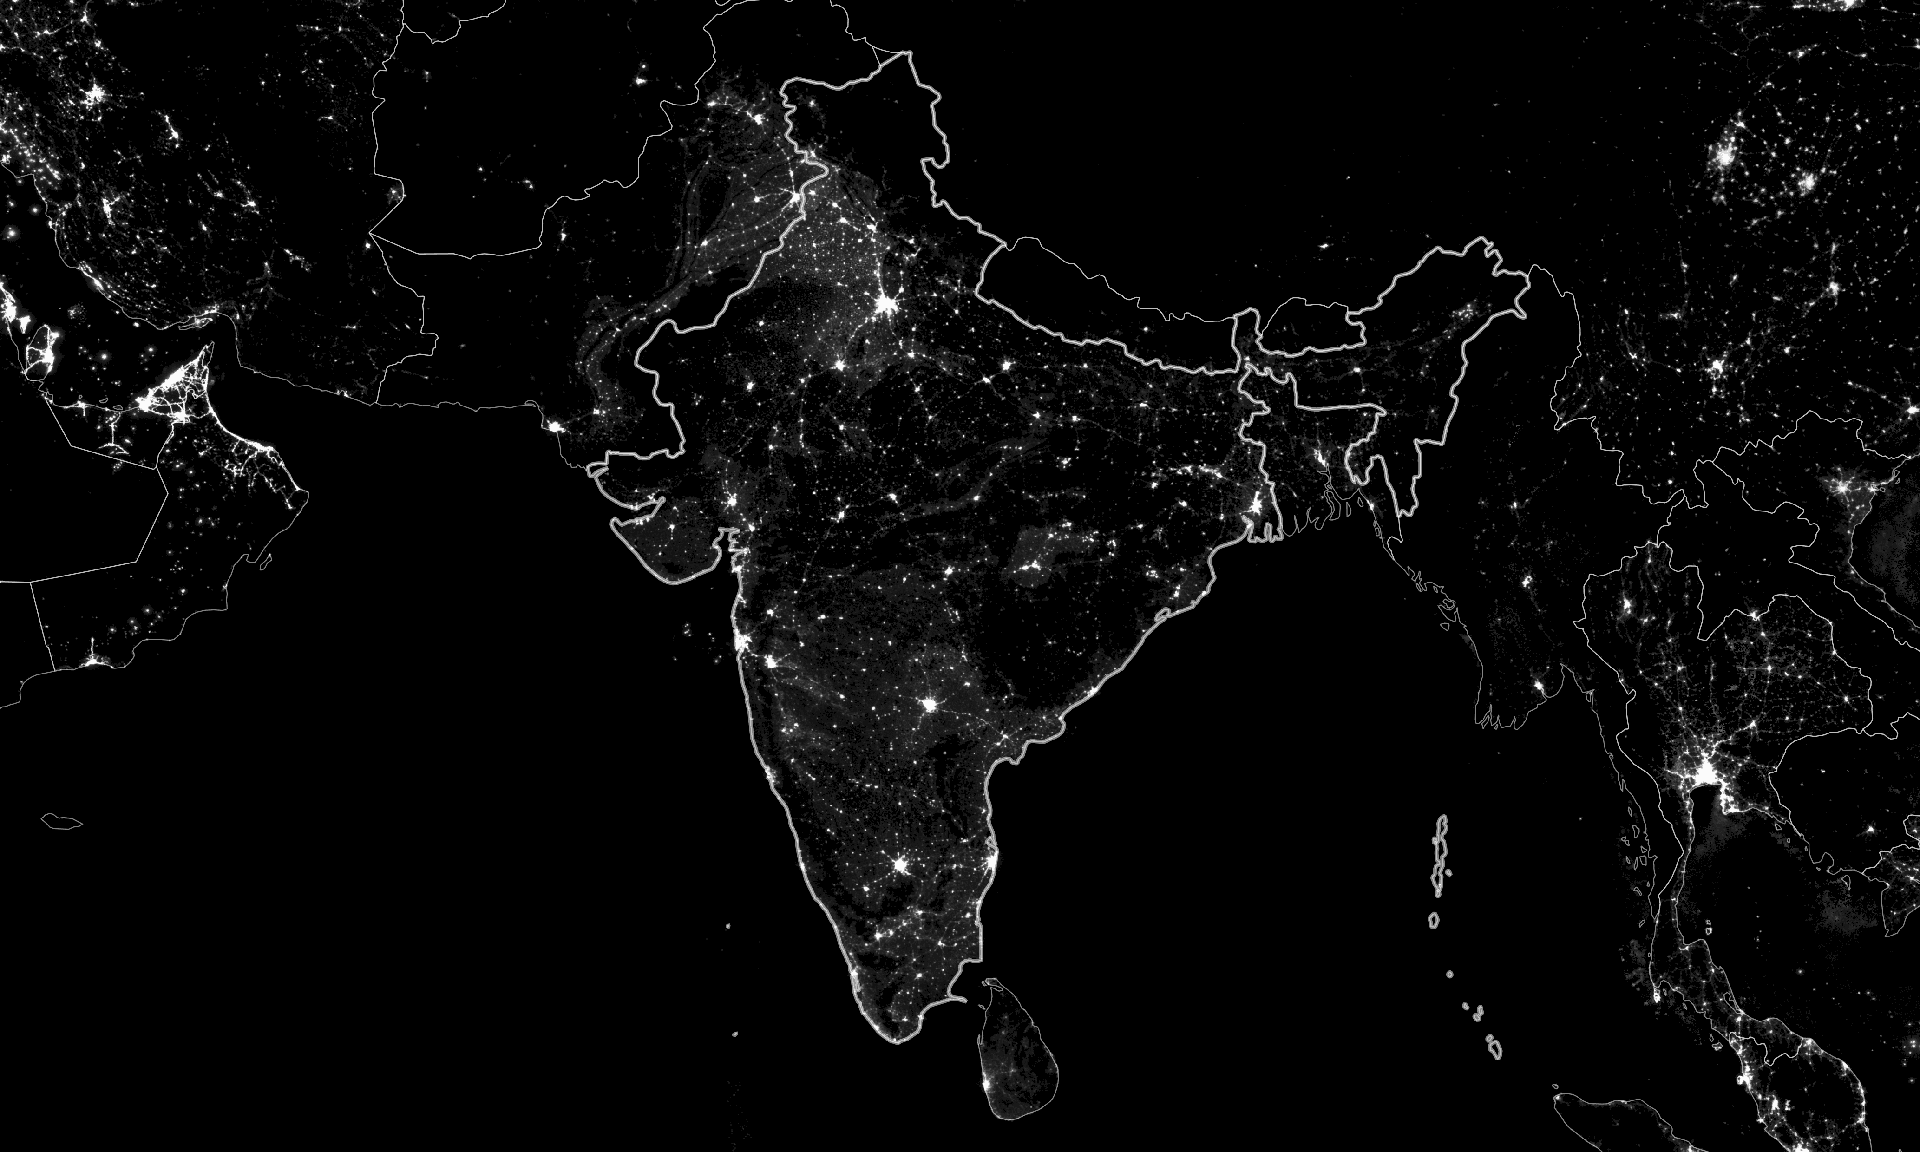
The Defense Meteorological Satellite Program (DMSP) has captured 10,000 satellite images of India over the last 20 years. We took this raw data — digitized by NOAA and analyzed by the Researchers at University of Michigan — and visualized it to help people draw conclusions about the change in electrification over time. To do this with such an enormous dataset, we used an Amazon RedShift cluster to calculate the monthly median light output for each village, district, and region in India, and then exposed this aggregate data in an open API. Finally, we built a fast and user friendly interface for the data, featuring an interactive map powered by Mapbox GL and vector tiles. These modern web mapping tools enabled us to create a map that seamlessly shows the light output for tens of thousands of villages at once, responding instantly as the user navigates through the twenty-year timespan.
Nightlights is a great example of how visualizing data can make a big impact and how a large dataset can be transformed into a usable, informative interface. Play with the tool to see for yourself.